
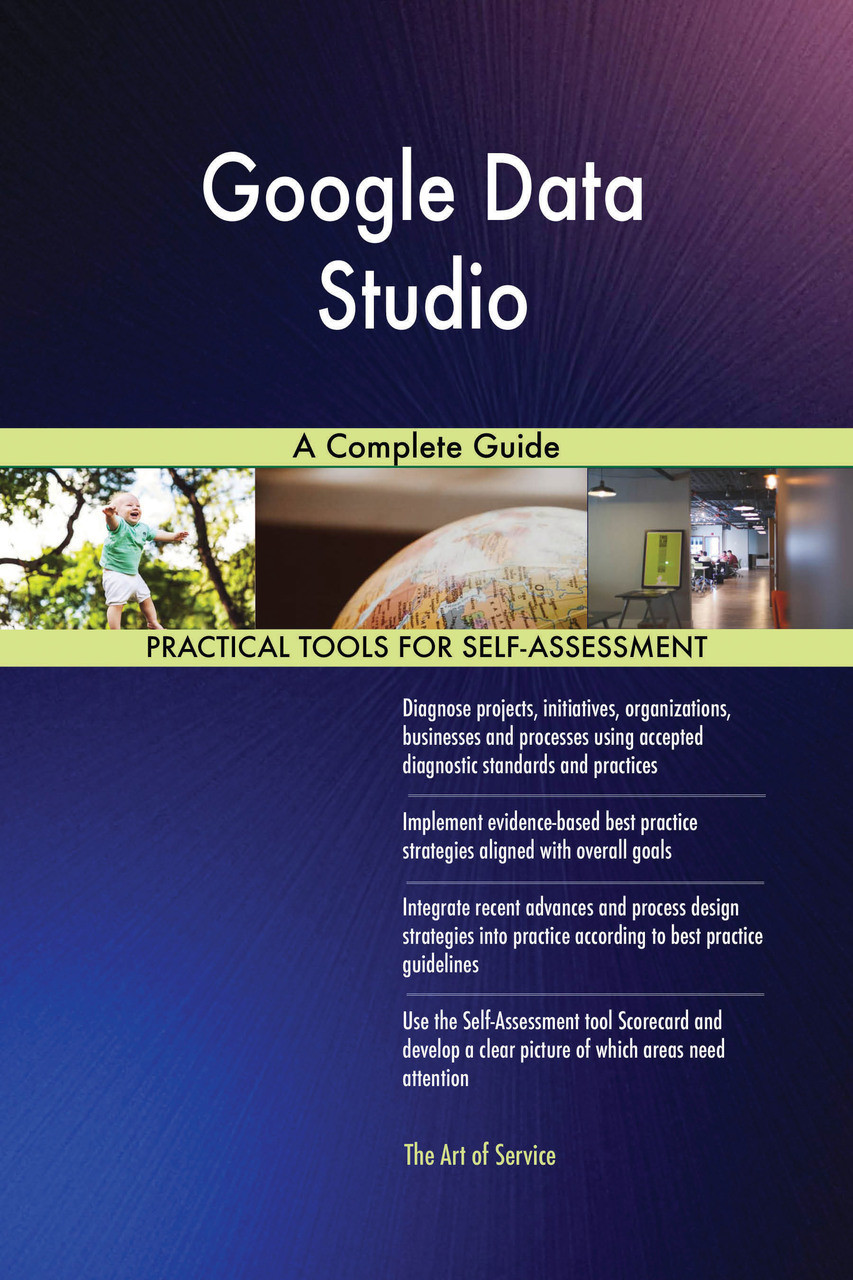
What does the Google Data Studio A Complete Guide include?
The guide provides a structured 60+ file digital playbook delivered by email within 24 business hours. It contains XLSX spreadsheets, calculators, dashboards, PDF guides, runbooks and a Platinum Tier set of master templates that cover every phase of Data Studio implementation, from initial data-source integration to ongoing governance and performance monitoring.
Are you still producing piecemeal Data Studio reports that mislead stakeholders, waste analyst hours and expose your organisation to costly data-quality failures? Without a proven, step-by-step implementation system you risk audit findings, delayed decision-making and losing competitive advantage. The Google Data Studio A Complete Guide delivers a ready-to-use digital playbook that instantly turns those risks into reliable, scalable visualisation capabilities.
What You Receive
- 60+ buyer-ready files (30-40 XLSX spreadsheets, calculators, scorecards and dashboards; 20-30 PDF guides, briefings, runbooks and playbooks) - gives you a complete toolbox to design, build and govern Data Studio dashboards without starting from scratch.
- Platinum Tier centrepiece files:
- Master Operations Playbook (PDF) - a single reference that maps every stage of Data Studio adoption.
- 90-Day Adoption Roadmap (XLSX) - a timeline that accelerates skill development and stakeholder buy-in.
- Implementation Template (PDF) - a repeatable framework for connecting BigQuery, Google Analytics and other sources.
- Anti-Pattern Catalogue (XLSX) - a checklist that flags common visualisation pitfalls before they cost you.
- Outcomes Dashboard (XLSX) - a live KPI monitor that proves the business impact of each report.
- Incident Response Runbook (PDF) - step-by-step actions for data-quality breaches.
- 01_Getting_Started guide (PDF) - quick-start instructions so you can launch your first compliant dashboard within a day.
- 02_Self-Assessment and Diagnostics (PDF/XLSX) - maturity assessments, gap-analysis worksheets and diagnostic matrices to pinpoint visualisation weaknesses.
- 03_Requirements and Goal-Setting (PDF/XLSX) - goal-setting templates and stakeholder-mapping tools that align dashboards with business objectives.
- 04_Models and Frameworks (PDF/XLSX) - comparison matrices, decision tools and best-practice frameworks aligned to Google’s documentation and industry visualisation standards.
- 06_Processes and Execution (PDF/XLSX, 13-17 files) - implementation playbooks, RACI templates, interview scripts and execution worksheets that standardise reporting across teams.
- 07_Performance and KPIs (XLSX) - measurement dashboards that track adoption, data-quality and business outcomes.
- 08_Quality and Governance (PDF/XLSX) - audit-prep checklists, policy templates and oversight tools that keep reports compliant.
- 09_Sustainment and Improvement (PDF/XLSX) - continuous-improvement frameworks to keep your visualisations future-proof.
- 10_Advanced Topics (PDF) - case archives and scenario libraries for complex, multi-source reporting.
- 11_Reference and Quick Cards (PDF) - at-a-glance cheat sheets for field calculations, error troubleshooting and dashboard design patterns.
- README.md and CUSTOMER_EMAIL.txt - onboarding note that explains how to access and use every file.
How This Helps You
- Eliminates inconsistent reporting → ensures every stakeholder receives the same accurate insights → reduces the risk of costly mis-informed decisions.
- Provides ready-made calculators and scorecards → cuts analyst build time from weeks to hours → frees resources for strategic analysis.
- Includes anti-pattern and audit checklists → catches data-quality issues before they trigger compliance penalties → protects your organisation from audit findings.
- Offers a 90-day adoption roadmap → accelerates skill uptake and organisational buy-in → prevents prolonged rollout delays that erode competitive advantage.
- Delivers performance dashboards → makes the business value of each report visible → justifies investment and drives continuous improvement.
Who Is This For?
- Data Analytics Managers who need to standardise dashboard delivery across multiple business units.
- Business Intelligence Leads responsible for translating raw data into executive-grade visualisations.
- Marketing Insights Directors who must integrate Google Analytics and BigQuery into single, actionable reports.
- Operations Performance Officers tasked with monitoring KPI dashboards for real-time decision making.
- Data-Driven Product Managers who require rapid, repeatable visualisation workflows to support product experiments.
Choose the Google Data Studio A Complete Guide today and equip yourself with a proven, file-based playbook that turns data chaos into clear, actionable insight. Your organisation’s data-visualisation maturity will accelerate, audit risk will fall, and you’ll stay ahead of the competition.